
Speed Up Your Performance
Team Clothing Collection & Sponsoring Package
Aero Coaching

Our services around aero coaching include support in data analytics, aero testing attendance, individual and tailored aero tips, support in pre- and post- competition analysis, finding a comfortable aero position for long-distance races or show how to get a UCI compatible set-up of a TT bike.
Products

Power to CdA: use recorded power data to measure your air resistance and optimize position and equipment.
Power to Speed: use recorded data from a real ride, especially GPS and power data, to analyse the effect of different set ups including aerodynamic settings. Pre- and post-competition analysis.
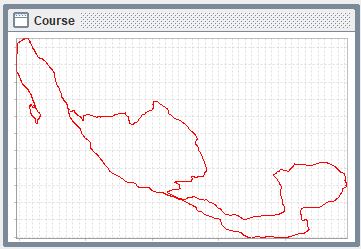
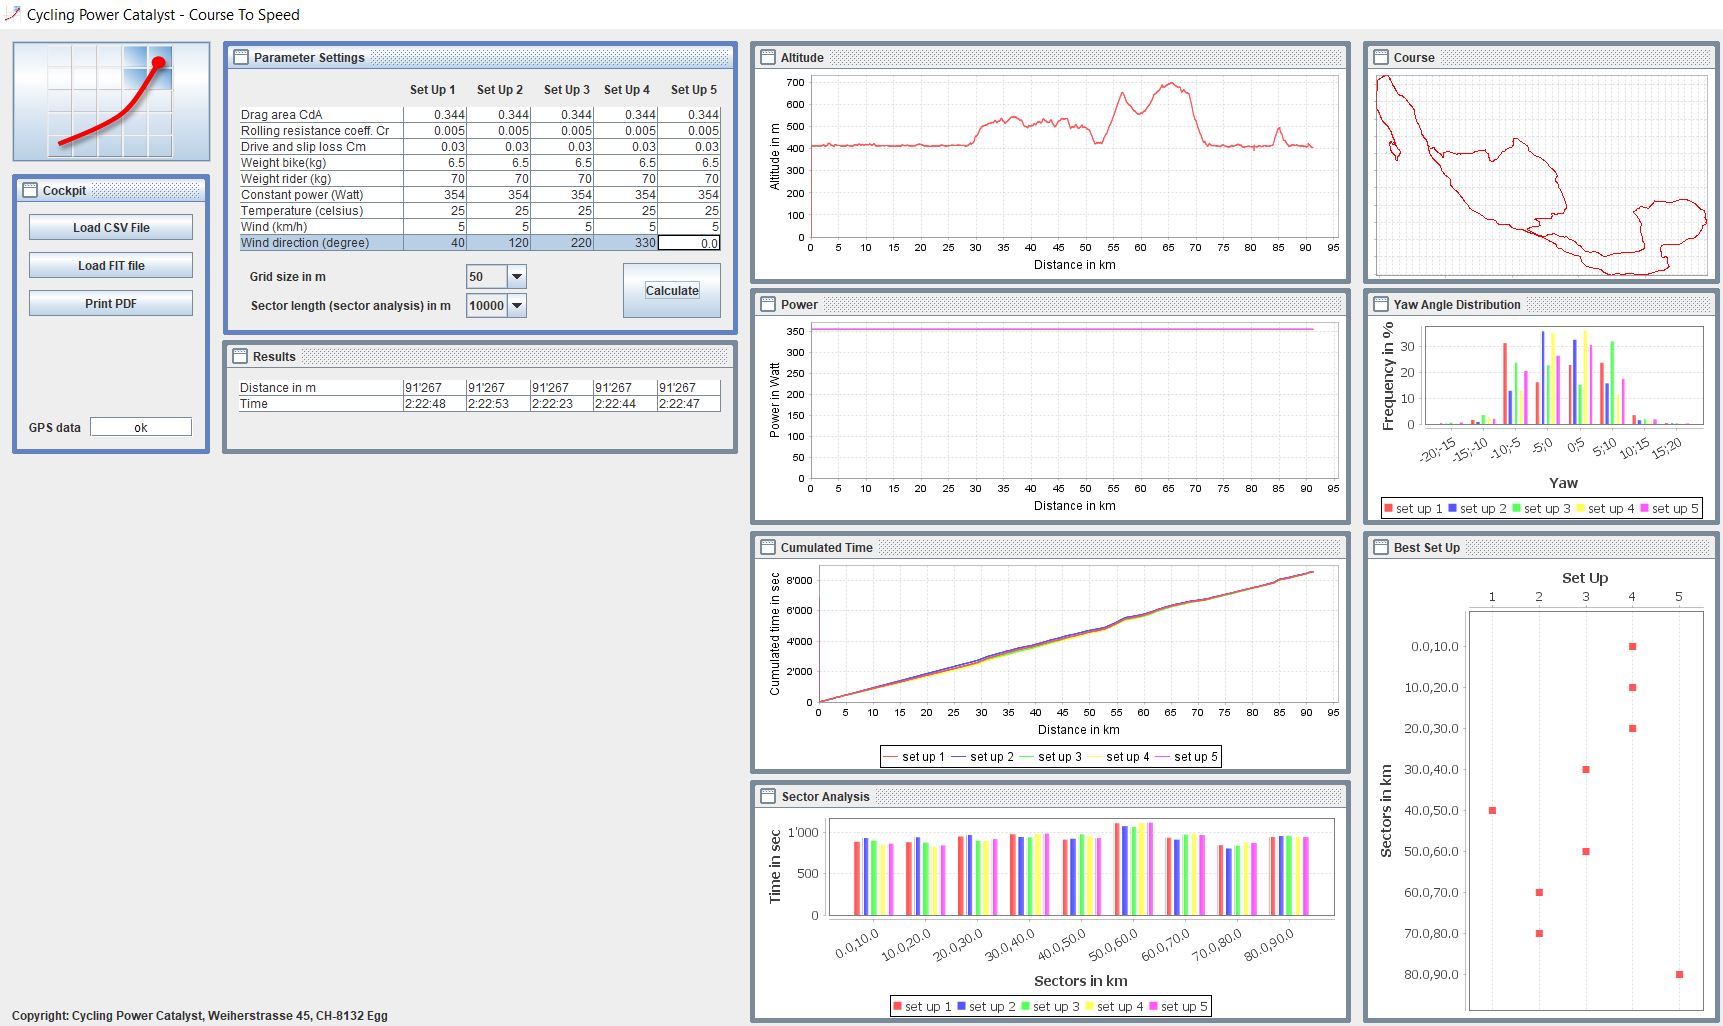
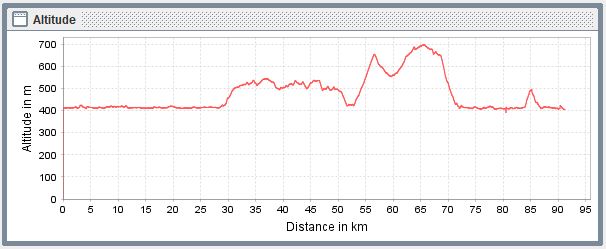
Course to Speed: download GPS course data and analyse different settings, especially useful to do pre-race analysis.


Product Features

-
Estimate CdA based on recorded data (incl. Chung Method)
-
Load course & power data (example courses included) in different formats including FIT
- Set up of bike and rider data
- Specify wind conditions
- Simultaneous calculation of 5 settings
- Analyse yaw angle distribution to optimize your material
- Analyse race time
- Sector analysis and best race set
- Unlimited number of calculations
- Available in English and German
- User guide
- Java based